2026 Private Treaty Offering
What are EPD’s?
Expected Progeny Differences (EPD’s) are an estimation of an animals genetic worth as a parent. They are based on animal models which combine all information known about an individual and its relatives to create a genetic profile of the animal’s merits. We can then compare these profiles between animals within the same breed.
The American Hereford Association (AHA) currently produces expected progeny differences (EPDs) for 17 traits and calculates three profit ($) indexes
Click here for the American Hereford Association EPD trait definitions!
2 Year Old Bulls
 |
 |
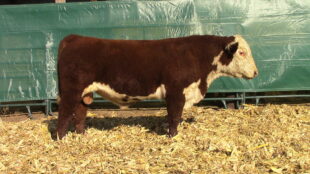 |
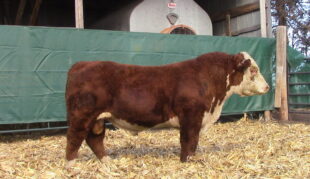
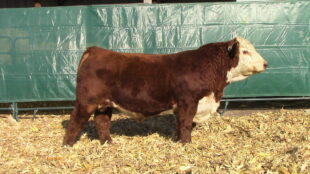
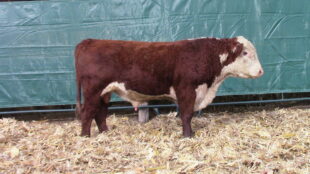
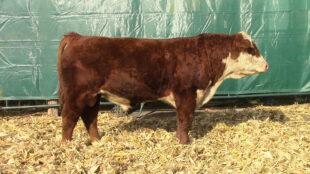
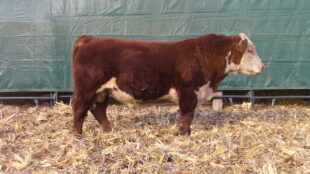
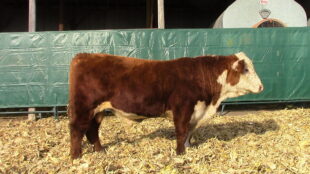
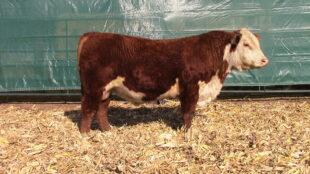
| 400M | 404M | 411M |
| Click for Video! – SOLD! | Click for Video! – SOLD! | Click for Video! – SOLD! |
 |
 |
 |
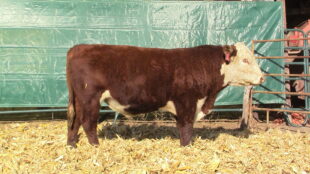
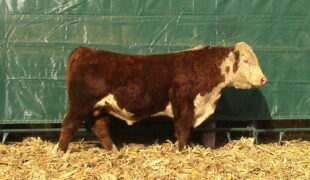
| 412M | 413M | 414M |
| Click for Video! – SOLD! | Click for Video! – SOLD! | Click for Video! |
**Click on registration number for full pedigree
| ID | Reg Number | Sire | Birth Date | Birth Weight | CE | BW | WW | YW | MM | M&G | FAT | REA | Marb. |
| 400M | 44627189 | Benton | 1/1/2024 | 90 | -3.8 | 5.0 | 67 | 104 | 25 | 58 | -0.006 | 0.57 | 0.13 |
| 404M | 44629829 | Houston | 1/5/2024 | 90 | 1.9 | 2.9 | 70 | 115 | 32 | 67 | 0.064 | 0.84 | 0.27 |
| 411M | 44628645 | Houston | 1/16/2024 | 88 | 0.5 | 3.1 | 68 | 111 | 29 | 63 | 0.034 | 0378 | 0.29 |
| 412M | 44627191 | FinalTest | 1/17/2024 | 87 | 2.1 | 2.4 | 62 | 105 | 30 | 61 | 0.014 | 0.56 | 0.23 |
| 413M | 44628650 | Venture | 1/18/2024 | 88 | 0.1 | 3.1 | 68 | 110 | 32 | 66 | 0.064 | 0.49 | 0.24 |
| 414M | 44630422 | Resolve | 1/18/2024 | 90 | 4.9 | 1.0 | 63 | 96 | 26 | 57 | 0.054 | 0.82 | 0.42 |
| 415M | 44627197 | Benton | 1/19/2024 | 80 | 1.8 | 2.3 | 63 | 98 | 26 | 58 | 0.004 | 0.52 | 0.25 |
| 418M | 44628648 | Venture | 2/1/2024 | 86 | 2.5 | 2.4 | 63 | 97 | 33 | 64 | 0.064 | 0.45 | 0.29 |
| 438M | 44627212 | Leader | 2/25/2024 | 86 | 3.4 | 2.5 | 50 | 80 | 32 | 57 | 0.004 | 0.59 | 0.03 |
| 443M | 44627213 | Leader | 2/28/2024 | 86 | 6.8 | 1.6 | 54 | 87 | 36 | 63 | 0.034 | 0.51 | 0.09 |
| 447M | 44627715 | Leader | 2/29/2024 | 86 | 3.7 | 2.4 | 53 | 84 | 35 | 61 | 0.034 | 0.58 | -0.06 |
| 450M | 44627717 | Hoss | 3/1/2024 | 88 | 1.6 | 3.2 | 62 | 98 | 32 | 63 | -.006 | 0.49 | 0.14 |
| 453M | 44627722 | Leader | 3/6/2024 | 86 | 4.8 | 2.2 | 47 | 78 | 31 | 55 | 0.034 | 0.53 | -0.05 |
| 455M | 44627723 | Benton | 3/6/2024 | 82 | 0.6 | 3.5 | 66 | 102 | 29 | 62 | -0.006 | 0.31 | 0.09 |
 |
 |
 |
| 415M – scurred | 418M | 438M |
| Click for Video! – SOLD! | Click for Video! -SOLD! | Click for Video! – SOLD! |
 |
 |
 |
| 443M | 447M | 450M |
| Click for Video! | SOLD! | Click for Video! |
 |
 |
|
| 453M | 455M | |
| Click for Video! – SOLD! | Click for Video! – SOLD! |